As a developer and SRE who regularly works with distributed systems, I’ve often found myself struggling with the complexities of log management. The promise of powerful tools like Grafana Loki is enticing, but the learning curve associated with LogQL, Loki’s query language, has been a constant pain point.
That’s why I’m excited to share my experience with Explore Logs, a new open-source application from Grafana Labs that provides a much more user-friendly interface for browsing and analyzing logs.
Leveraging the Power of Grafana Explore
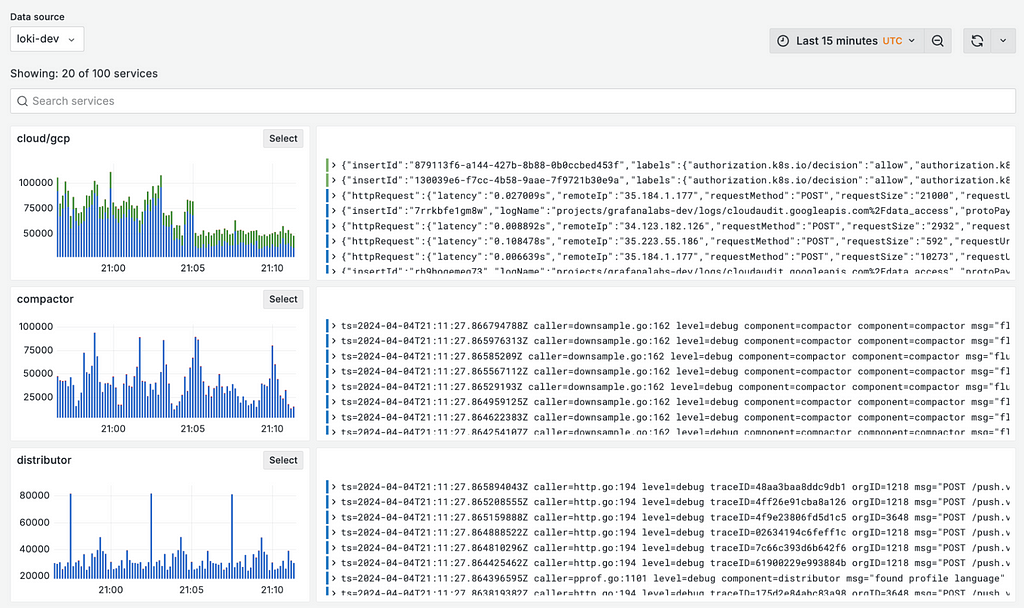
Explore Logs leverages the existing Explore functionality within Grafana, which was originally designed for querying metrics data. By extending Explore to work seamlessly with Loki, Grafana Labs has created a log management experience that feels natural and intuitive, even for those of us who aren’t LogQL experts.
Under the hood, Explore Logs is still utilizing Loki’s powerful log aggregation and query capabilities, but it abstracts away the complexity of LogQL through a series of intuitive UI components. This allows to focus on the task at hand, rather than having to remember the syntax and structure of a specialized query language.
 ### Key Features That Make a Difference
The standout features of Explore Logs for me include:
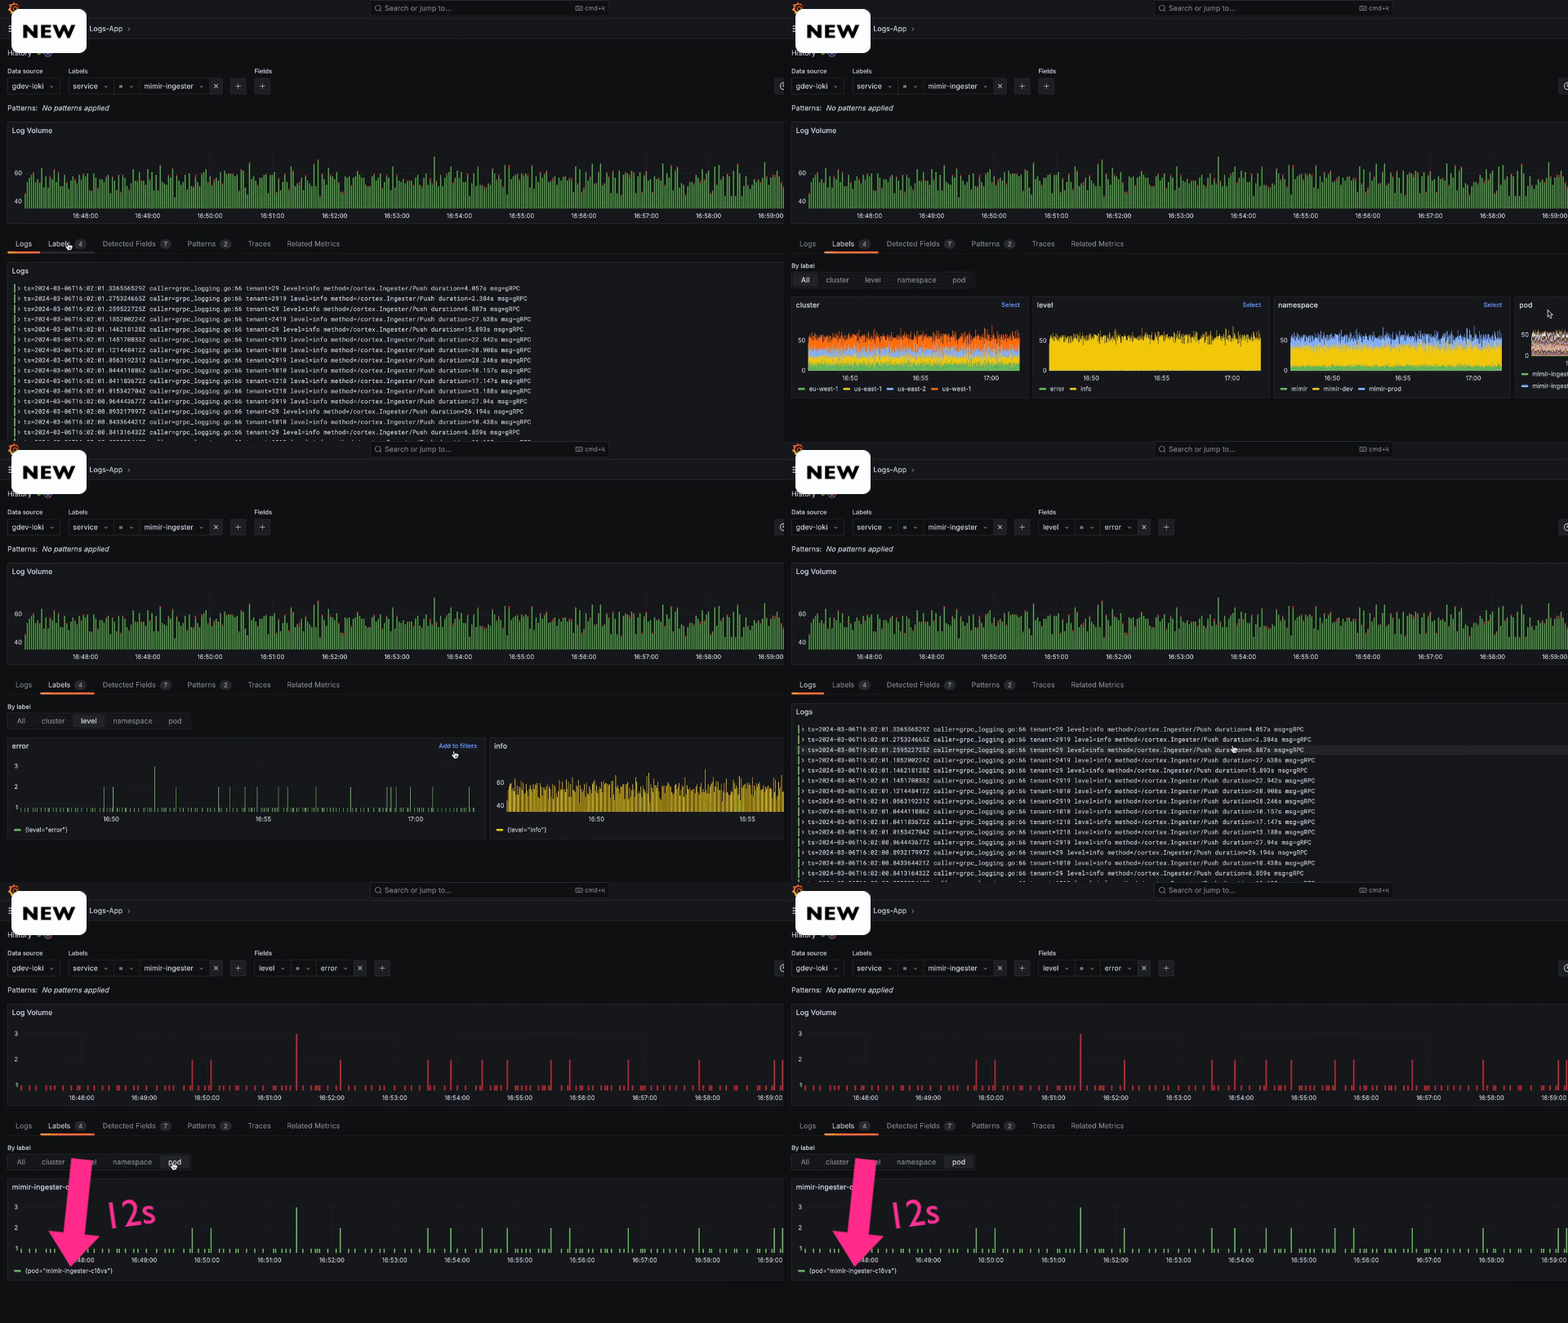
Labels: Explore Logs automatically detects and surfaces the labels associated with log data, making it easy to filter and group logs by these key-value pairs. The visual representations of the log volumes for each label are particularly helpful in identifying the most relevant data.
Detected Fields: In addition to labels, Explore Logs also integrates Loki’s ability to automatically extract structured fields from log lines. These detected fields are displayed in a clear, grid-like view, and I can use them to further refine log exploration.
Pattern Matching: One of the more advanced features that I’ve found incredibly useful is Explore Logs’ pattern matching capabilities. The application can automatically identify common templates or structures across log lines and present them as “patterns.” I can then leverage these patterns to quickly filter out noise or focus on specific types of log entries, saving me valuable time.
Search: For those times when I need a more freeform text search, the simple search bar in Explore Logs has proven to be a game-changer. Being able to perform case-sensitive searches across rendered log lines is a feature I didn’t know I needed until I had it.
Open in Explore: If I ever find that I do need the full power of LogQL to accomplish a particular task, Explore Logs includes a seamless integration with Grafana’s Explore UI. I can easily transition to the more advanced interface while preserving current context, ensuring a smooth and efficient workflow.
Community Feedback and Concerns
While the announcement of Explore Logs has generated excitement, the Grafana community has also voiced some concerns and feedback based on their experiences with existing log management solutions.
Many users expressed a desire for a simpler, more text-file-like experience when viewing logs, rather than having to learn complex query languages like LogQL. As one user commented, “all I have ever wanted to do, when looking at logs, is see the log from one process, from beginning to end, as a text file.” The ability to easily download log files and analyze them locally using familiar tools was seen as an important missing feature.
Some users also found the setup and configuration of log aggregation tools like Loki to be overly complex and time-consuming, with confusing documentation. There were concerns about the performance and cost of hosted log management solutions, with one user describing Loki as “incredibly slow” compared to the expense.
Another common theme was the desire for Explore Logs to more closely emulate the simplicity and ease-of-use of traditional text-based log viewing, without sacrificing the advanced aggregation and analysis capabilities of modern log management platforms. As one user put it, “LogQL is nothing like SQL. Try aggregating and quickly you’ll be asking yourself wtf an instant query is and how is that different.”
Grafana will need to carefully balance the needs of users who prefer a more traditional log viewing experience with the powerful querying and analysis features required for managing complex, distributed systems. Addressing these community concerns will be crucial to ensuring Explore Logs is a successful addition to the Grafana ecosystem.
A More Accessible Log Management Experience
As someone who has struggled with log management in the past, I’m thrilled to see Grafana Labs taking steps to make the process more user-friendly and accessible. By combining the power of Grafana and Loki, Explore Logs delivers a log management experience that is tailored to the needs of developers, SREs, and other IT professionals like myself.
I encourage everyone in the Grafana community to try out Explore Logs and provide feedback to help shape its future development. With the public preview now available, there’s never been a better time to explore the possibilities of this exciting new tool.
Simplify Your Logs Management with Grafana’s New Explore Logs App was originally published in devgorilla on Medium, where people are continuing the conversation by highlighting and responding to this story.